Community Server

  • Subscribe to our RSS feed.
  • Twitter
  • StumbleUpon
  • Reddit
  • Facebook
  • Digg

Tuesday, 7 August 2012

D3JS: A new area of dashboarding

Posted on 11:06 by Unknown
D3JS: A new area of dashboarding

Is this the start of a new era for dashboard generation?

What has been happening so far:
Business intelligence software providers: each of them have their own dashboard implementation - if you are lucky, they make use of open standards. Some of these dashboards look quite dated nowadays, they are very restricted in what can be achieved. And there are also some new cool kids on the block which offer fancy visualisation.

If you created your dashboard from scratch using one of the open standards, you would have probably still reached for dedicated charting libraries.

Now working with charting libraries is in the beginning usually quite easy. You define all the attributes and throw the data at it and it will nicely render what you asked for. You get what you want in quite a short amount of time. But then, what happens if you want to move beyond these ‘out-of-the-box’ functionality? Customization is usually the tricky bit.

Now somebody out there had a quite clever idea: Why not get rid of all the restrictions. Let’s start something from scratch which is based on open standards (HTML5), does not use any charting libraries at all and allows you to create everything you ever envisioned. Sounds too good to be true?

Take a piece of paper. Take a pen. Draw something. You can draw anything. Right?
Write some SVG (Scalable Vector Graphic) “code” (or use Inkscape). You can draw anything. Right? [And imagine you can also animate all of this as well]

What’s the limit?

Now if we could only have data drive these drawings (and HTML tags).

You are lucky: You have a new best friend: Data Driven Documents, short D3 (or D3js).

Data Driven Documents:

Provides an API which allows you to dynamically manipulate the DOM structure of your HTML file. This includes any standard HTML (for example a table) as well as SVG. D3 also provides functions to easily create complex SVG elements (paths for pie charts in example). This is just some of it, there’s more covered in their API reference.

Over the last few weeks I went through several examples and tutorials which are available online and I am deeply impressed! Based on these examples I put together a dashboard with a pie, bar and line chart and an HTML table. The end user can click on a piece of the pie chart and the bar and line charts will be updated respectively. The min and max dots of the bar charts will be highlighted automatically. There is also some animation included. It’s a simple demo to illustrate the potential.  My code could be improved further, but I am running out of time:

Click here to see the simple dashboard in action (Modern Web Browsers required)

Charts as well standard text and table elements can be styled centrally by using CSS. In the past, having worked with various dashboard and report technologies, I always disliked it when I had to define global styles for charts separately - and in most of the cases this feature wasn’t even available. Now, D3js and HTML5 make this finally possible! The setup is extremely simple, your only dependency on the server side is the D3js library and on the client side a modern web browser. You can use standard web development tools to create your dashboard. These are just a few of the advantages.

Resources

I strongly recommend checking out the example code and tutorials which are available online, in example on the D3js site. Scott Murray’s tutorial is one of the best tutorials I have come across in recent times. Jump in and enjoy the advantages of D3js!
Read More
Posted in D3JS, Dashboarding, HTML5, SVG | No comments

Tuesday, 5 June 2012

Free Book: Talend Master Data Management Practical Starter Guide

Posted on 08:11 by Unknown
Master Data Management has gained a strong momentum in the last few years. I spent the last few months putting together a small practical book on Talend Open Studio for Master Data Management. This book should give people unfamiliar with the topic and the tool an easy starting point as it walks you through several hands-on tutorials. The book available online here (for free).
If you do find any errors, please let me know here by posting a comment and I will update the document as soon as possible.
Read More
Posted in | No comments

Tuesday, 17 April 2012

Creating and using external Jasper Report styles with JasperWave

Posted on 12:04 by Unknown

Creating and using external Jasper Report styles with JasperWave

The JasperWave team just released version 0.9.5 of their JasperReports Designer. Among the main new features are External Style Templates, JavaBean data source and custom Java classes.

Having worked in the past a lot with external styles I can tell a story or two about how challenging it sometimes was to go down this route. The “challenging” bit only refers to actually using external and internal styles with the designer GUI.
It is needless to say that using external style sheets is the most effective way to go in large scale projects. Creating these external style sheets is fairly easy, but the problem arises when your report designer GUI does not offer a nice integration. The JasperWave team identified this as a shortcoming in current designers and hence had their own take at implementing this feature. Now let’s have a look if they succeeded in their goal:

Download the latest version of the JasperWave report designer from here. You have the option to use a standalone client (this is the easiest setup) or to use the Eclipse plugin. If you go down the Eclipse route, make sure that you first install GEF (as highlighted on the downloads page).

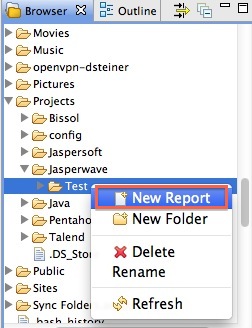
Once installed successfully, fire up JasperWave Report Designer. In case you are using the standalone version, you will find the Browser in the bottom left hand corner. Navigate to a convenient folder to store our report. Right click on this folder and choose New Report:

Specify a filename and click on Finish. Your screen should now look like this:
Now let’s create two new external style sheets for the purpose of this tutorial. Click on the Plus button in the Style Templates area in the Properties panel (right hand side):

In quotation marks write table_external_styles.jrtx:
Click OK.
In the same fashion create another external stylesheet called title_external_styles.jrtx. Remember to enclose this in quotation marks!

Time to save our report! Click on the Save button (or alternatively depending on OS CTRL+S or CMD+S)

In the Browser right click on your folder and choose Refresh. The folder content should now look like this:

As you can see, JasperWave created the external style sheets for us.

Now it is time to introduce you to our new best friend, the Styles Manager. This is the one place where you can manage all your styles, be it external or internal styles, one or many external style sheets. This is extremely convenient, as it means you don’t have to wade through many different files to get an overview of your styles.
You can access the styles manager either by clicking on the style button in the top tool bar or if you click on a report element (like a Text Field) you can find the style button next to each property in the properties panel. The latter enables a very convenient access to a specific style.

So let’s create some styles:
  1. Click on the Style button in the top tool bar:
  2. In the Styles Manager, click on New Style:
  3. Name the style report_title
  4. Next we can define where we want the new style to be stored. In the Location pull down menu choose the external style sheet we created earlier on: title_external_styles.jrtx. Note: Embedded means that the style will be stored within the report file (internal style).
  5. Set a few properties for this style like Font, Font size, Bold etc. Note how the greyed out circular arrow button turns blue once you set the style. This is a very good indicator as you can easily spot which styles have been set and which ones not! If you ever want to set the Default value for a particular style, just click this button!
    Also watch the
    Style preview as you add properties!
  6. Next create a new style called table_header_string. Set the Location to table_external_styles and set a few properties for this style like Font, Font size, Bold etc.
  7. Finally create an internal style called custom_subtitle. Set the Location to Embedded and set a few properties for this style like Font, Font size, Bold etc.
  8. If you take a look now at the styles listing, you will see that each style is suffixed by its location in case of an external style:

Now let’s quickly have a look on how to use these styles. Add 2 static text elements to the report title section and one static text element to the column header. Populate them with some text.

Mark the first static text element and expand the Style section in the properties panel. Choose report_title:

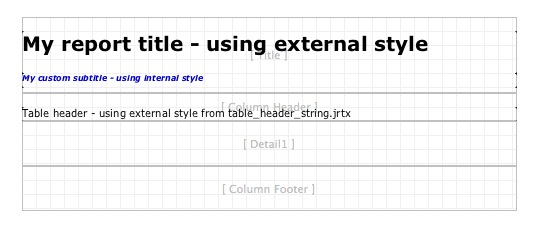
Assign the custom_subtitle style to the next static text element and finally the table_header_string style to the last static text element. Your report should now look something like this:
As you can see, the styles are instantly applied in the report design area.

Now we realize that we actually want the table heading to have a different foreground color. I show you now another way to access the Styles Manager: Mark the table header static text element and click on the Style button in the Style properties section:

You will see that in the Styles Manager this style is automatically selected. Change now the foreground color to green.

In the course of this short tutorial you learnt how easy it is with JasperWave to use external as well as internal styles. I have to say that this implementation of styles in a Jasper Reports Designer is the best I have seen so far! I do sincerely hope that this project gets the community support it deserves! You can find a more detailed documentation on using styles with Jasperwave on their website.
Read More
Posted in | No comments

Wednesday, 21 March 2012

Talend Open Studio: Retrieve PostgreSQL error messages

Posted on 12:06 by Unknown

Retrieve PostgreSQL error messages

When using the PostgresqlOutput component, sometimes you will only see “Call getNextException to see the cause” in the error log in case something goes wrong:
So how do we get a detailed error message?
The solution is to switch off the batch mode. Simply click on the Advanced settings of the PostgresqlOutput component and untick Batch size:


If you cannot see Use Batch Size, scroll all the way down!

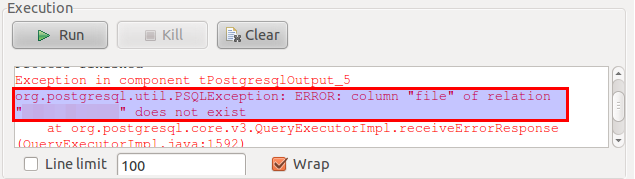
Now save your job and rerun it: You should now get a useful error message:


Now you have the right info to solve the problem! Once the problem is solved, don't forget to switch on the batch mode again.
Read More
Posted in PostgreSQL, Talend Open Studio | No comments

Sunday, 11 March 2012

PostgreSQL: Auto generating a sample dataset (II)

Posted on 03:00 by Unknown
Some time ago I presented a simple solution to generate date dimension data in PostgreSQL using standard SQL. The below approach is another take on this and probably a little bit easier to read then the previous approach.
This time I made use of the GENERATE_SERIES function. As a simple example, we first use a Common Table Expression to generate a dataset which holds 10 successive dates and then in the main query we extract some date information:


WITH date_series AS (
SELECT
DATE(GENERATE_SERIES(DATE '2012-01-01', DATE '2012-01-10','1 day')) AS date
)
SELECT 
date 
, EXTRACT(DAY FROM date) AS day
, EXTRACT(MONTH FROM date) AS month
, EXTRACT(QUARTER FROM date) AS quarter
, EXTRACT(YEAR FROM date) AS year
FROM 
date_series
;


Read More
Posted in | No comments

Thursday, 1 March 2012

Talend open sources Big Data features

Posted on 12:13 by Unknown
Just a month ago I reported here that Pentaho open sourced their Big data features in their data integration tool (Kettle). And yesterday Talend revealed on their blog that they are about to release a new Talend Open Studio for Big Data. This version will natively support Hadoop Distributed File System (HDFS), Pig, HBase, Sqoop and Hive. Moreover, Talend Open Studio for Big Data will be bundled with Hortonwork's Apache Hadoop distribution.
These are exciting times for data integration experts and companies alike. First of all, this means more choice in terms of open source data integration tools. Secondly, competition is always good and vital to a product's future development.
Read More
Posted in Big Data, Data Integration, Hadoop, Kettle, Pentaho Data Integration, Talend | No comments

Saturday, 25 February 2012

Talend Open Studio: How to set up context variables

Posted on 11:18 by Unknown

Talend Open Studio: How to set up context variables

A common concept of making your ETL process easy to configure is to use global variables. This caters for scenarios when you have to move your ETL processes from development to testing and then to production. The idea is to change a few variable values in a central file and then your ETL process will already run on another environment: What a time saver!

In this tutorial we will take a look at how to achieve this with Talend Open Studio for Data Integration.


Common global variables

First let’s have a look at settings that we would like use a variable for:

Database details:
source_database
source_username
source_password
source_port
source_schema
source_server

target_database
target_username
target_password
target_port
target_schema
target_server

reject_database
reject_username
reject_password
reject_port
reject_schema
reject_server

logging_database
logging_username
logging_password
logging_port
logging_schema
logging_server

ETL job execution:
date_start
date_end
temp_data_dir
source_dir

The above are just examples, there are many more use cases.


How to create global variables

Talend has the concept of context variables. You can access them in the settings fields by pressing CTRL+SPACE.

In Talend Open Studio you can create several context groups which hold various variables.
Think of context groups as a bucket for related variables. For each context group you can define various contexts like production, devolpment, test etc. This is extremely useful when moving your ETL jobs from one environment to the other.

Note: You can create as many context groups as you want. Currently, every time you create a context group, you have to define the contexts as well. I added a new feature request which will allow you to define the contexts once in the project settings so that each time when you create a new context group these contexts are assigned by default. This should help to keep the contexts more consistent and manageable across multiple context groups.

To create new variables, right click on Contexts in the repository and choose Create context group:

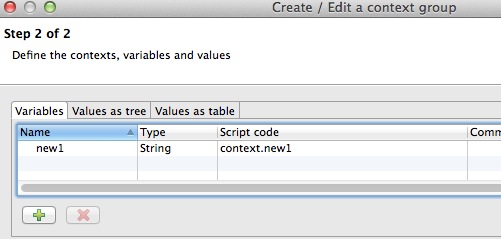
First create the variables by pressing the + button and assign it a type:
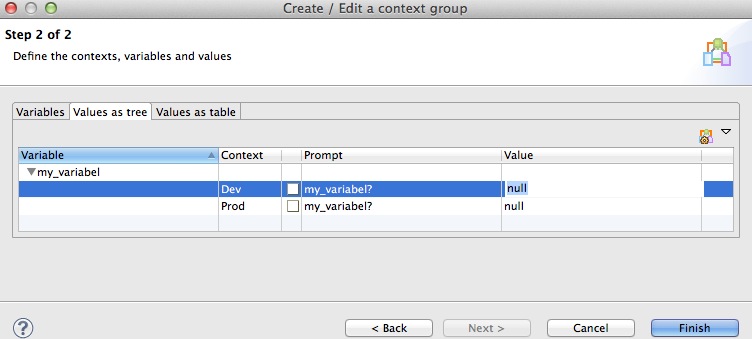
Then click on the Value as tree tab and expend your variable definition. Note that the default context will be called default. To change this name and/or to add other contexts, click on the context icon on the top right hand corner:
The Configure Contexts dialog allows you to edit existing contexts or to add new ones. Once you defined your contexts, click OK.

Now you will see your new/altered context show up in the main dialog. Define if you want a prompt and prompt text for each variable/context combination. Finally define a value:
When you are done, click on Finish.

Specifying the variables this way allows you to use them across multiple jobs. Think of it as an approach to easily manage your variables across all your jobs. You can create variables for each job as well, but these ones will local to that job only (and hence not be available for other jobs).


How to use repository context variables within jobs

Once you have the context variables defined in the repository, you can easily add them to your job:
  1. Open the job and click on the Context tab. Then click on the Repository icon:
  2. Select the variable you want to add and click OK.
  3. These variables will now show up in the context tab. Note that the variable will be available with the context prefix:
You can now use the variables in the component settings by pressing CTRL+SPACE:


Here two examples on how to use the variables in a query:

"SELECT * FROM raw_data WHERE date>= DATE '"+context.date_start+"' AND date<= DATE '"+context.date_end+"'"

"SELECT * FROM raw_data WHERE date>= TO_DATE('"+context.date_start+"','yyyyMMdd') AND date<= TO_DATE('"+context.date_end+"','yyyyMMdd')"

And here you can see an example using a context variable to define part of the file path:


How to define the context on execution

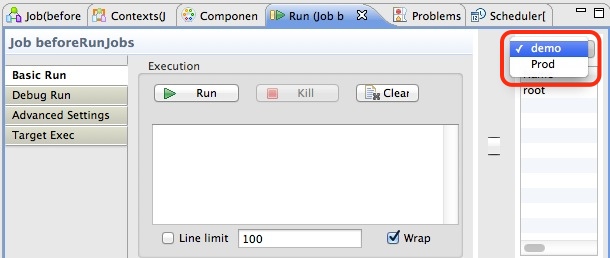
While designing you job, you can choose the context from the Run tab:
When you export your job, you will also have an option to specify the context.


How to load context variables dynamically

You can use the tContextLoad component to load the variables dynamically in example from a file when you run the jobs with different environments (See forum question for details).


Easily setup context variable for your connection

When setting up connections in the metadata repository, you can easily auto-generate context variables for the settings. To do so, press the Export as context button:
In the next dialog you can give it a name, then click next and you will have to option to alter the auto-generated variable list:
Now add a new query to the Metadata Repository using the SQL Builder. Make sure to tick context mode. Go to the Designer tab, right click on the text area and choose Add tables. Use the visual tool to build your query. Then switch back to the Edit tab and you will see the SQL Builder made use of the context variables.


I hope that this short introduction to context variables will help you to make your data integration jobs easier to configure!
Read More
Posted in | No comments
Newer Posts Older Posts Home
Subscribe to: Posts (Atom)

Popular Posts

  • Pentaho Data Integration: Remote execution with Carte
    Pentaho Data Integration: Remote execution with Carte Tutorial Details Software: PDI/Kettle 4.1 (download  here ), installed on your PC and ...
  • Pentaho Data Integration: Scheduling and command line arguments
    Pentaho Data Integration (Kettle): Command line arguments and scheduling Tutorial Details Software: PDI/Kettle 4.1 (download here ), MySQL S...
  • Pentaho PostgreSQL Bulk Loader: How to fix a Unicode error
    When using the Pentaho PostgreSQL Bulk Loader step, you might come across following error message in the log: INFO  26-08 13:04:07,005 - Po...
  • Pentaho Data Integration: Best practice solutions for working wit
    Pentaho Data Integration: Best practice solutions for working with huge data sets Assign enough memory Open pan.sh and kitchen.sh (and spo...
  • Using Parameters in Pentaho Report Designer
    Using Parameters in Pentaho Report Designer Introduction How to define a parameter Additional info about the new parameter dialog Hidden Par...
  • Pentaho Data Integration and Infinidb Series: Bulk Upload
    Pentaho Data Integration and InfiniDB Series: Bulk Upload Introduction Prepare Tables Using mainly Kettle steps Check if file exists Setup I...
  • PDI: Full Outer Joins
    Pentaho Data Integration: Full Outer Joins Creating full outer joins in Pentaho Data Integartion (PDI aka Kettle) is a fairly straight forwa...
  • Using regular expressions with Pentah...
    Using regular expressions with Pentaho Data Integration (Kettle) There are quite some transformations steps that allow you to work with regu...
  • Pentaho Kettle Parameters and Variables: Tips and Tricks
    Pentaho Kettle Parameters and Variables: Tips and Tricks This blog post is not intended to be a formal introduction to using parameters and ...
  • Pentaho Data Integration: Designing a highly available scalable s
    Pentaho Data Integration: Designing a highly available scalable solution for processing files Tutorial Details Software : PDI/Kettle 4.1 (do...

Categories

  • "Bulk Loader"
  • "Bulk Loading"
  • "Hadoop"
  • "Kettle"
  • "Pentaho Book"
  • "Pentaho Data Integration"
  • "Pentaho Kettle"
  • "Pentaho Report Designer MDX MQL JDBC Parameters How To"
  • "Pentaho Report Designer MDX Parameters"
  • "Pentaho Report Designer MQL Parameters"
  • "Pentaho Report Designer Parmaters"
  • "Pentaho Report Designer"
  • "Pentaho Reporting 3.5 for Java Developers"
  • "Pentaho Reporting Book"
  • "Routing"
  • "Schema Workbench"
  • "Testing"
  • "Unicode"
  • "Unit testing"
  • "UTF8"
  • Agile development
  • automated testing
  • Big Data
  • Book Review
  • C-Tools
  • CBF
  • Clustered transformation
  • Command Line Arguments
  • Community Build Framework
  • D3JS
  • Dashboarding
  • Data Integration
  • Data Warehouse
  • Database Change Management
  • Database Version Control
  • Date Dimension
  • DBFit
  • ETL
  • ETLFit
  • Federated database
  • Google Charts
  • Google Visualization API
  • Hadoop
  • HTML5
  • iReport
  • JasperReports
  • JasperSoft
  • JasperStudio
  • Kettle
  • Kimball
  • Loop
  • Master data management
  • Metadata
  • Metedata editor
  • Mondrian
  • multidimensional modeling
  • OLAP
  • Open Source
  • Parameter
  • Parameters
  • Pentaho
  • Pentaho BI Server
  • Pentaho Data Integration
  • Pentaho Data Integration 4 Cookbook
  • Pentaho Kettle
  • Pentaho Metadata Editor Tutorial
  • Pentaho Report Designer
  • PostgreSQL
  • PRD
  • Report Layout
  • REST
  • Routing
  • Saiku
  • Scheduling
  • Slowly Changing Dimension
  • Sqitch
  • SVG
  • Talend
  • Talend MDM
  • Talend Open Studio
  • Tutorial
  • Variable
  • Web service
  • Xactions

Blog Archive

  • ▼  2013 (24)
    • ▼  December (2)
      • Pentaho 5.0 Reporting by Example: Beginner’s Guide...
      • Going Agile: Test your Pentaho ETL transformations...
    • ►  November (3)
    • ►  October (2)
    • ►  September (1)
    • ►  August (3)
    • ►  July (2)
    • ►  June (1)
    • ►  May (2)
    • ►  April (1)
    • ►  March (3)
    • ►  February (1)
    • ►  January (3)
  • ►  2012 (20)
    • ►  November (3)
    • ►  October (3)
    • ►  August (1)
    • ►  June (1)
    • ►  April (1)
    • ►  March (3)
    • ►  February (5)
    • ►  January (3)
  • ►  2011 (19)
    • ►  November (3)
    • ►  July (2)
    • ►  June (1)
    • ►  May (4)
    • ►  April (2)
    • ►  March (1)
    • ►  February (3)
    • ►  January (3)
  • ►  2010 (17)
    • ►  December (1)
    • ►  November (6)
    • ►  September (1)
    • ►  August (1)
    • ►  June (2)
    • ►  May (1)
    • ►  April (3)
    • ►  February (1)
    • ►  January (1)
  • ►  2009 (18)
    • ►  December (3)
    • ►  November (1)
    • ►  October (5)
    • ►  September (7)
    • ►  July (2)
Powered by Blogger.

About Me

Unknown
View my complete profile