Community Server

  • Subscribe to our RSS feed.
  • Twitter
  • StumbleUpon
  • Reddit
  • Facebook
  • Digg

Friday, 4 February 2011

Pentaho Metadata Editor: Joining two fact tables

Posted on 14:14 by Unknown
Pentaho Metadata Model: Joining two fact tables

This tutorial was possible with the help of Will Gorman, Vice President of Engineering at Pentaho

The data
Metadata Model
My Suggestions


Tutorial Details

  • Software: PME 3.7 (download here), a database of your liking, in example MySQL
  • Knowledge: Intermediate (To follow this tutorial you should have good knowledge of the software and hence not every single step will be described)
  • Tutorial files can be downloaded here


The Pentaho Metadata layer is amazing: It allows end users to build reports without actually writing a line of SQL. Database and/or table changes can be easily accommodated by only changing the references in the metadata model and hence reports, dashboards, etc stay unaffected. 

While it is fairly easy to set up a metadata model with one fact table (and some dimensions), using more than one fact table (which also might have different granularity) posses a challenge for many users. Is it really possible to do this in PME (Pentaho Metadata Editor)? The answer is yes, although in the current version I don't consider it to be an ideal solution and I hope that in future it will be possible to visually design this in the relationship diagram. 

In this session I'd like to discuss the approach of integrating more than one fact table into your metadata model. 

The data


We will base our example on this simple schema:

CREATE SCHEMA 
metadatatest
;

CREATE TABLE
metadatatest.fact_sales
(
date_id INT(255),
location VARCHAR(70),
sales INT(255)
)
;

INSERT INTO 
metadatatest.fact_sales 
VALUES
(1,"London", 34),(1,"Manchester", 44),(2,"London",24),(2,"Manchester",35),(2,"Bristol",34),(3,"London",53)
;

CREATE TABLE
metadatatest.fact_stock
(
date_id INT(255),
location VARCHAR(70),
aisle VARCHAR(70),
stock INT(255)
)
;

INSERT INTO 
metadatatest.fact_stock
VALUES
(1,"London","aisle 1", 34),(1,"London","aisle 2", 44),(1,"London","aisle 3", 234),(1,"Manchester","aisle 1", 44),(1,"Manchester","aisle 2", 344),(2,"London","aisle 1",24),(2,"London","aisle 2",25),(2,"Manchester","aisle 1",35),(2,"Bristol","aisle 1",34),(2,"Bristol","aisle 2",324),(3,"London","aisle 1",53)
;

CREATE TABLE
metadatatest.dim_date
(
date_id INT(255),
date DATE
)
;

INSERT INTO
metadatatest.dim_date
VALUES
(1,"2011-01-01"),(2,"2011-01-02"),(3,"2011-01-03")
;

What we want to achieve is basically getting the same result out of PME as with following summary query:

SELECT
*
FROM
(
SELECT
date,
SUM(sales) AS sales
FROM
metadatatest.fact_sales s
INNER JOIN
metadatatest.dim_date d
ON
s.date_id=d.date_id
GROUP BY 1
) a
INNER JOIN
(
SELECT
date,
SUM(stock) AS stock
FROM
metadatatest.fact_stock s
INNER JOIN
metadatatest.dim_date d
ON
s.date_id=d.date_id
GROUP BY 1
) b
ON
a.date=b.date
;

Open your favourite SQL client and run these queries.

The aggregation query gives back following result:

Metadata Model

So let's start creating our Metadata model: One thing to keep in mind is that our two fact tables have different granularity. In PME you cannot just import them as physical tables, then place them both in a business model and create a relationship between them: Such a model will not return correct aggregations.

The critical element is: You basically have to specify the "physical tables" as join of your star schemas. What I mean by this is that you write a query that joins your fact table with all the dimension tables. This query returns a result set which can act as a "physical table" in PME (although the wording "physical table" doesn't make sense in the context, it is more a derived table or better said a view). 

In our case we will have two derived tables. These two derived tables have to have the same granularity:

  • Sales Table: a join of the fact_sales table with the date dimension
  • Stock Table: a jon of the fact_stock table with the date dimension, aggregated by date and location
  

  1. Open PME and create a new domain.
  2. Set up your database connection to the just created schema.
  3. Reference our two fact tables.
  4. Double click on the fact_sales table. The properties window will be shown.
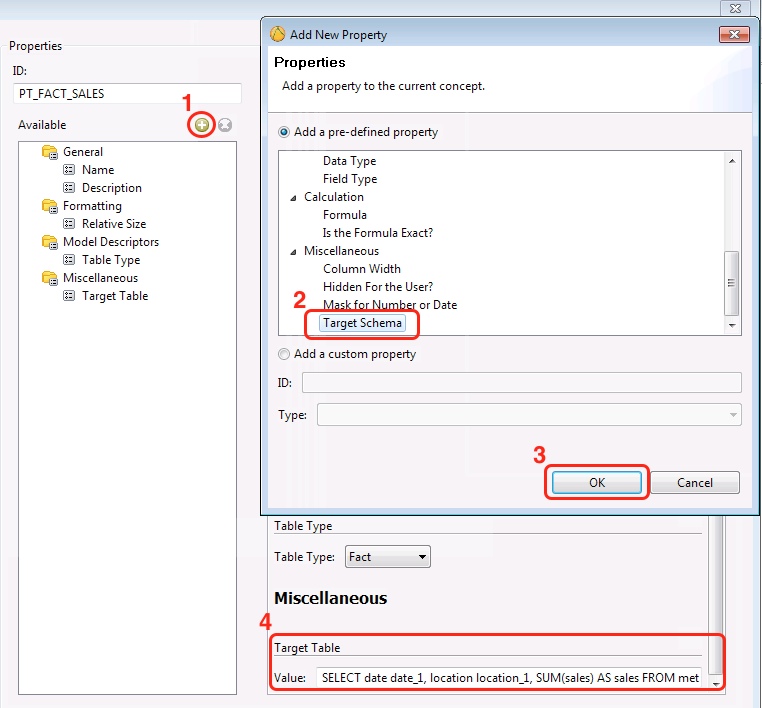
  5. Click on the green plus icon in the Properties section and add the Target Table property. Click OK.
  6. Fill out the Target Table field with this query:
     
    SELECT date date_1, location location_1, SUM(sales) AS sales FROM metadatatest.fact_sales s INNER JOIN metadatatest.dim_date d ON s.date_id=d.date_id GROUP BY 1, 2).
    Note we gave the date and location columns intentionally different names so that they are later on easier to distinguish from the other fact table's fields.
  7. Click OK to close the Properties window.
  8. Double click on the fact_stock table. The properties dialog will be shown.
  9. Click on the green plus icon and add the Target Table property. Click OK.
  10. Fill out the Target Table field with this query: Fill out the Target Table field with this query:
    SELECT date, location, SUM(stock) AS stock FROM metadatatest.fact_stock s INNER JOIN metadatatest.dim_date d ON s.date_id=d.date_id GROUP BY 1, 2
  11. Click OK to close the Properties window.
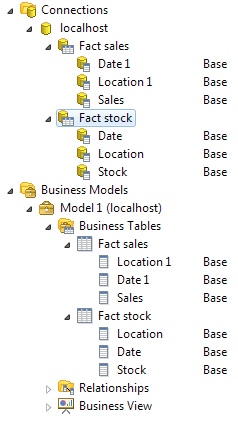
  12. Create a business model and drag and drop the physical tables into the Business Tables folder. Your Tables should now look like this (as you can see they have same granularity now):

  13. Next create the relationship: Drag and drop the business tables onto the canvas, hold down the CTRL key, mark the first table and then the second one and right click. Choose Add Relationship ...
  14. Set Relationship to N:N and Join type to Inner. 
  15. Tick Complex Join? and copy following lines into the Complex Join Expression: 
    AND([BT_FACT_SALES_FACT_SALES.BC_FACT_SALES_DATE_1]=[BT_FACT_STOCK_FACT_STOCK.BC_FACT_STOCK_DATE]; [BT_FACT_SALES_FACT_SALES.BC_FACT_SALES_LOCATION_1]=[BT_FACT_STOCK_FACT_STOCK.BC_FACT_STOCK_LOCATION])


  16. Click OK.
  17. Save the model. Now we are ready to test if it is working properly.
  18. Click on the Query Editor icon. Select Date, Sales and Stock as columns, then press the Play button. Examine the result: It returns exactly the same values as the SQL query we ran at the beginning of the tutorial. If you are curious you can as well click on the SQL icon and you can see which SQL query PME created under the hood.
My Suggestions

It is important to provide feedback to the developers of such great products as the PME. I can see in my daily work what a big impact this product makes. I can see end users who can finally create reports to their liking without running to a report designer and waiting for the result to be delivered. When you create a lot of reports you don't have to worry if a database change results in having to change all the references in all your reports. From my point of view a metadata model is a key element in a BI system. 

In the beginning of this article I already mentioned that I don't think the current way of setting up this solution is ideal. The reason for this is that it breaks the concept. Normally you would define the relationships between tables in a business model and the SQL would be automatically created. When dealing with more than one fact table (with different granularity), you have to use a completely different approach and write a SQL query yourself by joining your fact table all dimension tables and only then you can create the relationship diagram.
It's not a problem of "Oh I have to write a query", but it is more a problem of consistent approach. I'd really welcome if we could design the complete model in a relationship diagram (consistant approach) instead of hacking the shortcomings by providing SQL queries. I think the user experience would be much better.
I set up a JIRA case on the Pentaho website to, please show your support by voting for it and we might see this feature implemented soon!
At the end of the session I'd like the thank Will for his great support!

Read More
Posted in | No comments

Monday, 31 January 2011

Pentaho Data Integration: Remote execution with Carte

Posted on 13:31 by Unknown

Pentaho Data Integration: Remote execution with Carte

Tutorial Details

  • Software: PDI/Kettle 4.1 (download here), installed on your PC and on a server
  • Knowledge: Intermediate (To follow this tutorial you should have good knowledge of the software and hence not every single step will be described)
Carte is an often overlooked small web server that comes with Pentaho Data Integration/Kettle. It allows remote execution of transformation and jobs. It even allows you to create static and dynamic clusters, so that you can easily run your power hungry transformation or jobs on multiple servers. In this session you will get a brief introduction on how to work with Carte.
Now let's get started: SSH to the server where Kettle is running on (this assumes you have already installed Kettle there).

Encrypt password

Carte requires a user name and password. It's good practise to encrypt this password. Thankfully Kettle already comes with an encryption utility.
In the PDI/data-integration/ directory run:

sh encr.sh -carte yourpassword

OBF:1mpsdfsg323fssmmww3352gsdf7

Open pwd/kettle.pwd and copy the encrypted password after "cluster: ":

vi ./pwd/kettle.pwd


# Please note that the default password (cluster) is obfuscated using the Encr script provided in this release
# Passwords can also be entered in plain text as before
#
cluster: OBF:1mpsdfsg323fssmmww3352gsdf7

Please note that "cluster" is the default user name.

Start carte.sh

Make sure first that the port you will use is available and open.

In the simplest form you start carte with just one slave that resides on the same instance: 
nohup sh carte.sh localhost 8181 > carte.err.log &

After this, press CTRL+C .

To see if it started:
tail -f carte.err.log

Although outside the scope of the session, I will give you a brief idea on how to set up a cluster: If you want to run a cluster, you have to create a configuration XML file. Examples can be found in the pwd directory. Open one of these XMLs and amend it to your needs. Then issue following command:
sh carte.sh ./pwd/carte-config-8181.xml >> ./pwd/err.log

Check if the server is running

Issue following commands:

[root@ip-11-111-11-111 data-integration]# ifconfig
eth0      Link encap:Ethernet  HWaddr ...
     inet addr:11.111.11.111  Bcast:

[... details omitted ...]


[root@ip-11-111-11-111 data-integration]# wget http://cluster:yourpassword@11.111.11.111:8181

--2011-01-31 13:53:02--  http://cluster:*password*@11.111.11.111:8181/
Connecting to 11.111.11.111:8181... connected.
HTTP request sent, awaiting response... 401 Unauthorized
Reusing existing connection to 11.111.11.111:8181.
HTTP request sent, awaiting response... 200 OK
Length: 158 [text/html]
Saving to: `index.html'

100%[======================================>] 158         --.-K/s   in 0s

2011-01-31 13:53:02 (9.57 MB/s) - `index.html' saved [158/158]

If you get a message like the one above, a web server call is possible, hence the web server is running.

With the wget command you have to pass on the

  • user name (highlighted blue)
  • password (highlighted violet)
  • IP address (highlighted yellow)
  • port number (highlighted red)

Or you can install lynx:

[root@ip-11-111-11-111 data-integration]# yum install lynx
[root@ip-11-111-11-111 data-integration]# lynx http://cluster:yourpassword@11.111.11.111:8181

It will ask you for user name and password and then you should see a simple text representation of the website: Not more than a nearly empty Status page will be shown.

Kettle slave server

Slave server menu

   Show status


Commands: Use arrow keys to move, '?' for help, 'q' to quit, '<-' to go back.
  Arrow keys: Up and Down to move.  Right to follow a link; Left to go back.
 H)elp O)ptions P)rint G)o M)ain screen Q)uit /=search [delete]=history list


You can also just type the URL in your local web browser:
http://ec2-11-111-11-111.XXXX.compute.amazonaws.com:8181

You will be asked for user name and password and then you should see an extremely basic page.

Define salve server in Kettle


  1. Open Kettle, open a transformation or job
  2. Click on the View panel
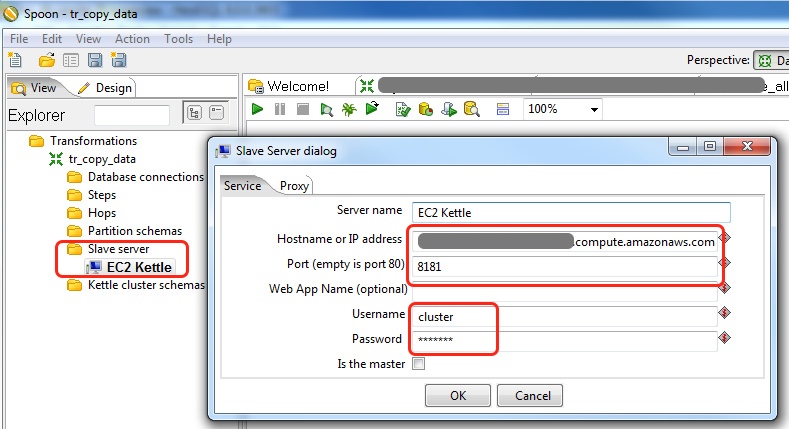
  3. Right click on Slave server and select New.


Specify all the details and click OK. In the tree view, right click on the slave server you just set up and choose Monitor. Kettle will now display the running transformations and jobs in a new tab:

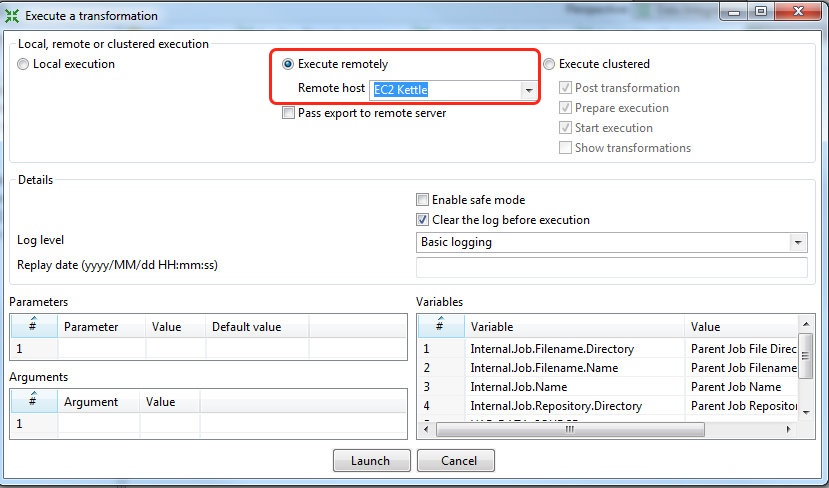
Your transformations can only use the slave server if you specify it in the Execute a transformation dialog.

For jobs you have to specify the remote slave server in each job entry dialog. 

If you want to set up a cluster schema, define the slaves first, then right click on Kettle cluster schemas. Define a Schema Name and the other details, then click on Select slave servers. Specify the servers that you want to work with and define one as the master. A full description of this process is outside the scope of this article. For further info, the "Pentaho Kettle Solutions" book will give you a detailed overview.

For me a convenient way to debug a remote execution is to open a terminal window, ssh to the remote server and tail -f carte.err.log. You can follow the error log in Spoon as well, but you'll have to refresh it manually all the time.

Read More
Posted in | No comments

Wednesday, 26 January 2011

Kettle Transformation Logging and Change Data Capture (New)

Posted on 13:09 by Unknown
Kettle Transformation Logging and Change Data Capture
Updated Version including the great feedback from Matt Casters and Jos (both authors of the fantastic "Kettle Solutions" book)

CDC
Setting up Logging
A safe approach to CDC
Sample File

Tutorial Details

  • Software: PDI/Kettle 4.1 (download here), MySQL Server (download here)
  • Knowledge: Intermediate (To follow this tutorial you should have good knowledge of the software and hence not every single step will be described)
  • Tutorial files can be downloaded here

CDC

In this session we will look at the extensive Pentaho Data Integration/Kettle 4.1 logging features. Now how come we also talk about Change Date Capture (CDC)? This is because Kettle incorporates logging of the start and end date for CDC in the logging architecture. 


If you are not familiar with CDC, here a brief summary: CDC allows you to capture all the data from the source system that has changed since the last time you ran the ETL process. Wikipedia gives a more detailed overview in case you are interested. In the easiest case you have some sort of timestamp or datetime column that you can use for this purpose. The following example will be based on a simple sales table that has a date column which we can use for CDC:


Note that this is dataset has actually quite old data, something that we have to keep in mind. What happens if new data gets inserted later on? More on this after the basics.


Open your favourite SQL Client (and start your MySQL server if it is not running yet) and issue following SQL statements:


USE
test
;

DROP TABLE IF EXISTS
`sales`
;

CREATE TABLE
`sales`
(
`date` DATETIME,
`product_type` VARCHAR(45),
`sales` INT(255)
)
;

INSERT INTO
`sales`
VALUES
('2010-01-20 00:00:00','Shoes',234),
('2010-01-20 00:00:00','Cheese',456),
('2010-01-21 00:00:00','Shoes',256),
('2010-01-21 00:00:00','Cheese',156),
('2010-01-22 00:00:00','Shoes',535),
('2010-01-23 00:00:00','Cheese',433)
;


SELECT
*
FROM
`sales`
;


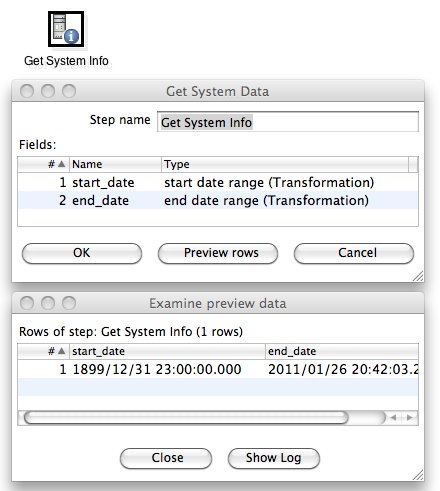
Now the way to get the timeframes for querying the data is to use the Get System Info step:


  1. Open Kettle and create a new transformation
  2. Drag and drop a Get System Info step on the canvas. You can find it in the Input folder.
  3. Double click on it and populate the names column in the grid with start_date and end_date.
  4. For the type choose start date range (Transformation) and end date range (Transformation) respectively

Click on Preview rows and you will see that Kettle displays a rather old datetime for the startdate (1899/12/31 23:00:00) and the current datetime for the enddate. Now this makes perfectly sense as with first run of your transfromation you want to get all the raw data from your source system. In case you don’t want this, I’ll show you a trick later on on how to change this.
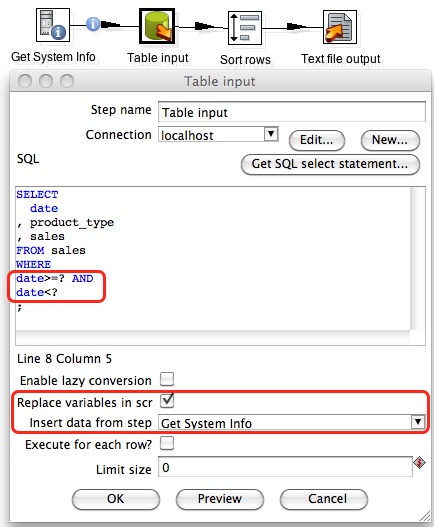
Now this is an easy approach for CDC. You can feed the start and end date from the Get System Info step to a Table Input step in example and use the start and end date in the WHERE clause of your SQL query:
SELECT 
date 
, product_type 
, sales 
FROM sales 
WHERE 
date>=? AND 
date<? 
;

The question marks will be replaced on execution by the start and end date (but make sure they are defined in this order in the Get System Info step).

Let's add some more steps to our transformation:

Make sure that you enable Replace variables in script? and choose the Get System Info step for Insert data from step. The hop between the Get System Info step and the Table Input step now also displays an info icon. 

Setting up Logging
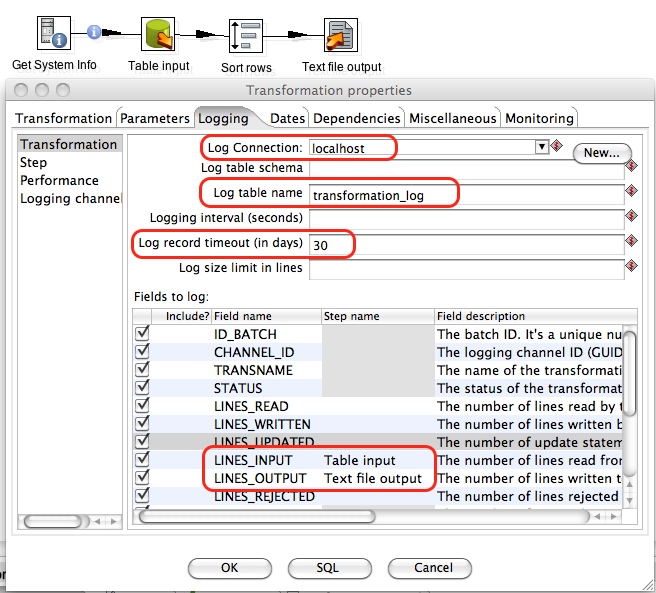
Kettle provides various levels of logging, the transformation logging being the one with the highest level. We will only look at the transformation logging here. 


  1. Press CTRL+T and the Transformation properties dialog will be displayed. 
  2. Click on the Logging tab and then highlight Transformation on the left hand side. 
  3. Our log will be placed in a database table, hence provide the info for the data connection and table name.
  4. We only want to keep the log records for the last 30 days, hence we set Log record timeout (in days) to 30.
  5. It’s best to keep all the logging fields (less maintenance)
  6. Provide step names for some of the fields, in example:

  • LINES_INPUT: specify the input step that represents the amount of imported data best. 
  • LINES_OUTPUT: specify the output step that represents the amount of imported data best

  1. Press the SQL button and Kettle will automatically generate the DDL (the create table statement) for you. Just press Execute and your logging table will be created on your specified database. Nice and easy!


So now we are all set and can run our transformation and see what’s happening. Click the Play button to execute the transformation. If your transformation executed successfully, close the transformation and open it again, then on the bottom click on the Execution History tab and you will so the logging information. (Kettle automatically reads the data from the table we just created).


Now pay attention to the Date Range Start and Date Range End field: It includes the data from our Get System Info step. Now execute the transformation again and see what happens (Click the Refresh button):


  • You can clearly see that Kettle new choose the CDC end datetime (which is the start datetime) of the last transformation execution for the start date. The last transformation execution has the Batch ID 0 in the screenshot above.
  • The CDC end date is set to the start date of the current transformation execution.

A safe approach to CDC

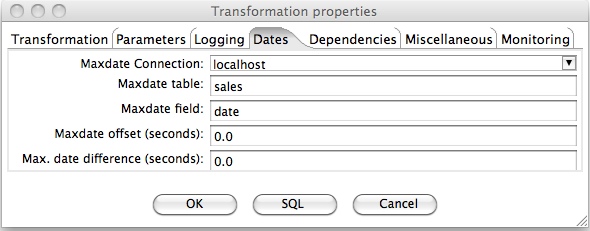
The CDC approach mentioned above is actually quite dangerous if your source data table doesn't get filled consistently. A safer approach is to use the maximum date of your source data as the CDC end date. Kettle provides this functionality out of the box: In the Transformation properties you can find a Dates tab. Click on it and provide following details of your fact table:


  1. Maxdate Connection: the database connection
  2. Maxdate table: the table name of your source table
  3. Maxdate field: the datetime field in your source table that you use for CDC
  4. Maxdate offset (seconds): If there are some inconsistencies in your source data, you can set a negative offset here. In example: -120 means that 120 seconds will be deducted from the max end date for CDC


As you can see from the screenshot above, I referenced again our main input table. So whatever the maximum date in this table is, Kettle will now use it for CDC. Open MySQL Client and delete all the records from our transformation log table, then start the transformation. As you can see from the Execution History Kettle now use the maximum date of our data set.


What more to say? Well, if you are unhappy with the first timeframe that Kettle chooses, just run the transformation once without any raw data input step, open a SQL client and update the end date with a date of your liking (this end date should be the start date that you want for the next execution). The next time you run your transformation, this datetime will be used for the start of your timeframe. 
Read More
Posted in | No comments
Newer Posts Older Posts Home
Subscribe to: Posts (Atom)

Popular Posts

  • Pentaho Data Integration: Remote execution with Carte
    Pentaho Data Integration: Remote execution with Carte Tutorial Details Software: PDI/Kettle 4.1 (download  here ), installed on your PC and ...
  • Pentaho Data Integration: Scheduling and command line arguments
    Pentaho Data Integration (Kettle): Command line arguments and scheduling Tutorial Details Software: PDI/Kettle 4.1 (download here ), MySQL S...
  • Pentaho PostgreSQL Bulk Loader: How to fix a Unicode error
    When using the Pentaho PostgreSQL Bulk Loader step, you might come across following error message in the log: INFO  26-08 13:04:07,005 - Po...
  • Pentaho Data Integration: Best practice solutions for working wit
    Pentaho Data Integration: Best practice solutions for working with huge data sets Assign enough memory Open pan.sh and kitchen.sh (and spo...
  • Using Parameters in Pentaho Report Designer
    Using Parameters in Pentaho Report Designer Introduction How to define a parameter Additional info about the new parameter dialog Hidden Par...
  • Pentaho Data Integration and Infinidb Series: Bulk Upload
    Pentaho Data Integration and InfiniDB Series: Bulk Upload Introduction Prepare Tables Using mainly Kettle steps Check if file exists Setup I...
  • Using regular expressions with Pentah...
    Using regular expressions with Pentaho Data Integration (Kettle) There are quite some transformations steps that allow you to work with regu...
  • Pentaho Kettle Parameters and Variables: Tips and Tricks
    Pentaho Kettle Parameters and Variables: Tips and Tricks This blog post is not intended to be a formal introduction to using parameters and ...
  • PDI: Full Outer Joins
    Pentaho Data Integration: Full Outer Joins Creating full outer joins in Pentaho Data Integartion (PDI aka Kettle) is a fairly straight forwa...
  • Pentaho Metadata Editor: Joining two fact tables
    Pentaho Metadata Model: Joining two fact tables This tutorial was possible with the help of Will Gorman , Vice President of Engineering at P...

Categories

  • "Bulk Loader"
  • "Bulk Loading"
  • "Hadoop"
  • "Kettle"
  • "Pentaho Book"
  • "Pentaho Data Integration"
  • "Pentaho Kettle"
  • "Pentaho Report Designer MDX MQL JDBC Parameters How To"
  • "Pentaho Report Designer MDX Parameters"
  • "Pentaho Report Designer MQL Parameters"
  • "Pentaho Report Designer Parmaters"
  • "Pentaho Report Designer"
  • "Pentaho Reporting 3.5 for Java Developers"
  • "Pentaho Reporting Book"
  • "Routing"
  • "Schema Workbench"
  • "Testing"
  • "Unicode"
  • "Unit testing"
  • "UTF8"
  • Agile development
  • automated testing
  • Big Data
  • Book Review
  • C-Tools
  • CBF
  • Clustered transformation
  • Command Line Arguments
  • Community Build Framework
  • D3JS
  • Dashboarding
  • Data Integration
  • Data Warehouse
  • Database Change Management
  • Database Version Control
  • Date Dimension
  • DBFit
  • ETL
  • ETLFit
  • Federated database
  • Google Charts
  • Google Visualization API
  • Hadoop
  • HTML5
  • iReport
  • JasperReports
  • JasperSoft
  • JasperStudio
  • Kettle
  • Kimball
  • Loop
  • Master data management
  • Metadata
  • Metedata editor
  • Mondrian
  • multidimensional modeling
  • OLAP
  • Open Source
  • Parameter
  • Parameters
  • Pentaho
  • Pentaho BI Server
  • Pentaho Data Integration
  • Pentaho Data Integration 4 Cookbook
  • Pentaho Kettle
  • Pentaho Metadata Editor Tutorial
  • Pentaho Report Designer
  • PostgreSQL
  • PRD
  • Report Layout
  • REST
  • Routing
  • Saiku
  • Scheduling
  • Slowly Changing Dimension
  • Sqitch
  • SVG
  • Talend
  • Talend MDM
  • Talend Open Studio
  • Tutorial
  • Variable
  • Web service
  • Xactions

Blog Archive

  • ▼  2013 (24)
    • ▼  December (2)
      • Pentaho 5.0 Reporting by Example: Beginner’s Guide...
      • Going Agile: Test your Pentaho ETL transformations...
    • ►  November (3)
    • ►  October (2)
    • ►  September (1)
    • ►  August (3)
    • ►  July (2)
    • ►  June (1)
    • ►  May (2)
    • ►  April (1)
    • ►  March (3)
    • ►  February (1)
    • ►  January (3)
  • ►  2012 (20)
    • ►  November (3)
    • ►  October (3)
    • ►  August (1)
    • ►  June (1)
    • ►  April (1)
    • ►  March (3)
    • ►  February (5)
    • ►  January (3)
  • ►  2011 (19)
    • ►  November (3)
    • ►  July (2)
    • ►  June (1)
    • ►  May (4)
    • ►  April (2)
    • ►  March (1)
    • ►  February (3)
    • ►  January (3)
  • ►  2010 (17)
    • ►  December (1)
    • ►  November (6)
    • ►  September (1)
    • ►  August (1)
    • ►  June (2)
    • ►  May (1)
    • ►  April (3)
    • ►  February (1)
    • ►  January (1)
  • ►  2009 (18)
    • ►  December (3)
    • ►  November (1)
    • ►  October (5)
    • ►  September (7)
    • ►  July (2)
Powered by Blogger.

About Me

Unknown
View my complete profile