Community Server

  • Subscribe to our RSS feed.
  • Twitter
  • StumbleUpon
  • Reddit
  • Facebook
  • Digg

Monday, 28 September 2009

Pentaho Kettle: Using Full Outer Join

Posted on 07:57 by Unknown

Today I came across a special use case for an outer join. I was planning to set up an ETL process that imports yesterday's revenue summary by summarizing the input of two tables.

The main problem was, that we might not have made any revenue yesterday at all, or there might be only revenue in one table but not the other.


Basically, if revenue figures exist in both tables, the process would be following:
- input data from table 1: date, service name, revenue_cars
- input data from table 2: date, service name, revenue_carparts

- join the tables, so that the output looks like: date, service name, revenue_cars, revenue_carparts
The problem is, as mentioned, that not every day data will be available in both tables. So I would have to implement a logic like this one:

  • IF input data table 1 NOT EMPTY AND input data table 2 EMPTY THEN output only data of table 1.
  • IF input data table 2 NOT EMPTY AND input data table 1 EMPTY THEN output only data of table 2.
  • IF input data table 1 NOT EMPTY AND input data table 2 NOT EMPTY THEN JOIN everything and output it.

All this can be achieved by using a FULL OUTER JOIN.

So your process in Kettle should be as follows:

  1. Drag and drop two "table input" steps into the working area and define the settings. Our query looks like this:For table1:
    SELECT
    date,
    service_name,
    COUNT(*) AS count
    FROM
    table1
    GROUP BY 1,2
    For table2:
    SELECT
    date,
    service_name,
    COUNT(*) AS count,
    SUM(rev) AS rev_sum
    FROM
    table2
    GROUP BY 1,2
  2. For each of them add a sort step and connect them with the table input. Make sure you sort the relevant fields in ascending order (in our case this is date and service_name).
  3. Drag and drop a Join step on the working area, connect them with the two sort steps and then define the two sort steps as input.
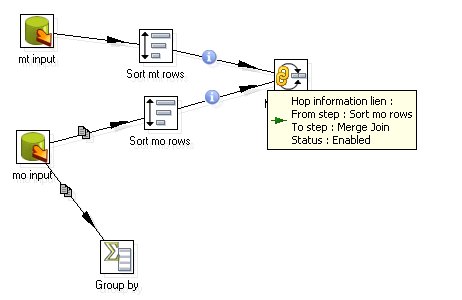


In this screenshot you can also see a Group By Step. This one is not in use at all. But in case you want to check if there is any output of this step, the group by step has an option called "Always give back a result row", which, when ticked, will set the aggregation to 0 (Zero). This might be useful in some cases. This is different to the Detect Empty Stream step, which only gives back a completely empty row in any case.

Ok, so now we have the FULL OUTER JOIN working. Have a look at the output by exporting it into a text or Excel file. You will see that in case both result sets didn't match, the number fields (count and rev_sum) are blank. As we want to use these fields later on in calculations, we have to assign a default value in case the number field is null.

Insert a If field value is null step, connect it to the previous step and double click on it afterwards. Tick "Select fields" and in the fields table add  count and rev_sum and assign a default value of 0 (Zero) to them.


Another thing that you will also have recognized by looking at the output is that we have now two additional fields: service_name_1 and date_1.

So now we have to do a check. In case there are matching values in both results, both

  • date and data_1 and
  • service_name and service_name_1
will be populated. If it is not in both, only one of them will be populated. So we are going to create a new variable called service_name_new and date_new that are going to replace the old ones in a "Modified Java Script Value" Step. Drag and drop this step on the working area and connect it with the Merge Join Step. Douple click on the Modified Java Script Value  Step and insert following script plus tick "Compatibility Mode":

if (service_name.isNull()) {
var service_name_new=service_name_1;
}
else
{
var service_name_new=service_name;
}

if (date.isNull()) {
var date_new=date_1;
}
else
{
var date_new=date;
}

Add service_name_new and date_new as output fields and define the type. Then add a Select values Step and add all the fields, but not service_name_1, service_name, date, date_1. Add another step to export it into Excel in example. Our whole process should look like this now (please ignore that some connection have the copy sign, this will not be the case with your process):

In this small tutorial we have now set up a nicely working FULL OUTER JOIN. I hope that you can implement this in your ETL processes now without any problems.
Read More
Posted in | No comments

Saturday, 26 September 2009

Full Review of "Pentaho Reporting 3.5 for Java Developers"

Posted on 11:54 by Unknown
This is the first book available that describes the functionality of the Pentaho Report Designer in detail. Will Gorman mainly focused on integrating the reports in Java applications and not so much on using it in combination with the Pentaho BI Server.
Overall, it is an excellent book. It guides you through various tutorials on how to create more complex reports. All the tutorials are fairly easy to follow. Some chapters of the book give a very detailled description of the available functionality and settings, which serves as an excellent reference.
Conclusion: I really enjoyed reading this book. From my point of view Will Gorman provides an interesting overview of Pentaho Reporting. If you are one of those users that are not familiar with Java and just want to get a general overview of Pentaho Reporting, then this book will also be a good ressource as well (just skip some of the pages then that describe the Java integration).
I hope that there will be a Part II of this book, as I certainly would have liked to know more about adding OLAP and Metadata sources to the report and parameterizing them.
Read More
Posted in "Pentaho Reporting 3.5 for Java Developers" | No comments

Wednesday, 23 September 2009

New books arrived

Posted on 05:42 by Unknown
After coming back from my business trip to South Africa I found a package of new books on my office desk. I finally received a copy of "Pentaho Reporting 3.5 for Java Developers", "Pentaho Solutions" and "The Data Warehouse Toolkit - The Complete Guide To Dimensional Modeling".
I think I am going to start with the Pentaho Reporting book, so that I can post a review here quite soon. It was a tough choice, as all the books sound very interesting.
Read More
Posted in | No comments

Thursday, 17 September 2009

Review "Pentaho Reporting 3.5 for Java Developers" Books Chapter 6

Posted on 23:16 by Unknown
Packt Publishing Ltd sent me yesterday the chapter 6 "Including Charts and Graphics in Reports" of the recently published "Pentaho Reporting 3.5 for Java Developers" Book to review. Excited as I was, I had to read it on the same day!
"Pentaho Reporting 3.5 for Java Developers" was written by Will Gorman, a long time Pentaho developer. I found chapter 6 easy to read, so I would say it is ideal for users that are new to Pentaho Reporting as well as those who have already a bit of experience with it. It's also great that the book covers the very latest version of the software, which brings a lot of major improvements.
The book is not only a valuable reference but offers easy-to-follow examples as well. It is definitely worth the investment, as it will save you hours of searching for the right info in forums, blogs and the wiki, which can sometimes be a bit frustrating.
Now let's have a look at chapter 6: Will kicks off by introducing all the different types of data sources (category, x-y, x-y-z and times series datasets, ...) that can be used in Pentaho Reporting and offers nice examples.
Next, all the chart rendering properties are discussed in detail, which serves as a great reference. This is followed by an introduction to all the various chart types that are available in Pentaho Reporting. In the first example you create a new report and load data from a HSQLDB, which you use as a data source for an area chart. Will speaks you through the chart properties that have to be set.
Bar, line, pie, ring, multipie, waterfall, bar-line, bubble, scatter, xy, scatter and radar charts are discussed next. Included is also a very nice example of a pie chart that resets itself with each group header (very useful!). The bubble chart, which uses 3 dimensions, is also very interesting.
The last page of this chapter describes how to insert static and dynamic images into your report.

Overall, I found this chapter very easy to read. It was a great idea to include examples as well and not only to concentrate on a description of the properties. All in all, I can strongly recommend this book based on this chapter and I am looking forward to reviewing the whole book, which should arrive in my post box next week. By the way, you can already buy the book here.
Read More
Posted in "Pentaho Book", "Pentaho Reporting 3.5 for Java Developers", "Pentaho Reporting Book" | No comments

Wednesday, 16 September 2009

Review coming soon ...

Posted on 04:40 by Unknown
Today I received a nice email from Packt Publishing Ltd asking me if I wanted to write a review about the new Pentaho Reporting 3.5 for Java Developers Book.
I've quite some books to read currently about OLAP and Data Warehouse Design, but I'll try to speed up to provide a review about this exciting new book in the next few months. So stay tuned!
Read More
Posted in | No comments

Saturday, 12 September 2009

New Books on Pentaho

Posted on 13:38 by Unknown
There hasn't been much literature around about Pentaho, at least not any that I know of. So far most people would search for info in the pentaho forum or wiki. But recently things have changed. There is now whole book about setting up Pentaho with MySQL called "Pentaho Solutions", which you can order from Amazon. This one tries to cover basically every component of Pentaho, which should be a great support for first time users.
Another book was published recently as well, called "Pentaho Reporting 3.5 for Java Developers" by Will Gorman, a long term Pentaho developer. This book will provide you everything you need to know about Pentaho Reporting 3.5. I've already ordered this books and I am quite looking forward to read them!
Read More
Posted in | No comments

Friday, 24 July 2009

The 10 Seconds Pentaho Metadata Editor Tutorial

Posted on 06:05 by Unknown

Quick Step By Step Guide

You can find the main Pentaho Wiki doc here.
This is an updated (2013-08-19) and extended version of the original tutorial which I posted here a few years ago. It will take you more than 10 seconds now to read through it, but instructions should be more precise now than before.

Specifying JNDI and adding the JDBC driver


  1. Define a JDNI Connection. You have to use the same JNDI connection as you specified on the BI Server (in the Pentaho Administration Console).The JDBC details can be specified in the jdbc.properties file in the following directory:<pme-root-dir>/simple-jndi

    Add the following (amend to your requirements):
    dwh/type=javax.sql.DataSource
    dwh/driver=com.mysql.jdbc.Driver
    dwh/url=jdbc:mysql://localhost:3306/pentaho
    dwh/user=root
    dwh/password=
    The first part before the forward slash is the JDNI name (so in this case dwh).
  2. Check if the required JDBC driver is installed under<pme-root-dir>/libext/JDBC
    If not, download the JDBC driver from your vendor’s website and copy the jar file into this folder.

Importing the physical tables


  1. Start PME by running the following command in the PME root directory:sh ./metadata-editor.sh
  2. Click on File > Save and specify a good name for your metadata model.
  3. Right click on Connections on the top left hand side and choose New Connection .... Define your connection details, make sure you choose JNDI in the Access selection and specify the same JNDI name in the Settings section as you originally specified in the jdbc.properties file.
    Some interesting options are found in the
    Advanced section: If you work with a database like PostgreSQL or Oracle that support proper schemata, you can define the default schema to use here. Also, if you have columns of type boolean you can also enable support for them:

    After entering all the details, click the
    Test button to make sure that your connection details are correct. Once you get a successful return message, click OK.
  4. Right click on the database connection you used created choose Import Tables:
  5. Expand the database node (dwh in the screenshot below) so that you can see all the imported tables:
  6. Specify table properties: Double click on each table to specify various settings. In example specify if it is a fact or dimensional table. For measures configure as well the aggregation type. If you want to add calculated fields, it's time to do so now: Double click on the respective table. Once the window is open, click on the + icon. Give the field a new name (i.e. PC_Amount_of_users). Define the aggregation type (i.e. Count). Define Data Type. If you don't know the length and precision yet, set it to -1. Define the formula (if you have just a simple count or sum, then only write the name of the column in there). That's it. (Field type can stay on "other").
    In the formula field you can use database specific functions as well (i.e. "YEAR(date)"). In this case you have to click on "Is formula exact?".
    You can add other properties like text alignment or date mask by clicking on the + icon.

Understanding Is the Formula Exact?

You can create add columns which are based on native SQL fragments, in example:
((CURRENT_DATE - start_date)/30)::int + 1
You specify this in the Formula Value field:
If you tick Is the Formula Exact? this basically means that the PME engine will not try to interpret this SQL fragment but instead push it directly to the database.

The disadvantage of this approach is that you might end up using functions which are specific to your database, so the model will not be that easily portable to other DBs (in case you ever have to migrate it).

Another common use case is to add a measure in case your raw data table doesn’t have one:

Defining a business model


  1. Right click on Business Model and select New Business Model. Name it etc.
  2. Drag and drop the tables onto the main working area.
  3. Double click on the table and go to Model Descriptor. If the type is incorrectly set (or not applicable for this model) click on the overwrite icon and define the respective table type (fact or dimension). Click OK.
  4. In order to create relationships between tables, select the two tables while pressing down the CTRL key and then right click on the last table and choose New Relationship:
    Another way to do this, although not that convenient, is to right click on the work area and choose
    New Relationship:

Create a business view


  1. Once the business tables and relationships are established, we can create the business view. Right click on Business View and select New Category. An easier way to do this is to choose Tools > Manage Categories (or right click the Category Editor icon in the toolbar). This will bring up the Category Editor dialog: Just click the + icon to add new categories. Define Categories, i.e. Date, Measures, Countries etc. Categories are basically buckets that help you organize the various business columns.
  2. Next we want to assign business columns to each category. If you created your categories in the tree view, right click on Business View and choose Manage Categories. Once in the Category Editor, use the arrows to move the fields into the categories.

Testing the metadata model

Now that the main metadata model is defined ... it is time to test the model. Click on the Query Builder icon in the toolbar and run some test queries. You can check the generated SQL by clicking on the SQL icon.

Publish the metadata model to the Pentaho BI Server

If testing is successful, publish the model to the BI server (Click on File > Publish To Server ...). The final metadata model is saved as an XMI file. On the BI Server, there can be only one XMI file per solution folder. Make sure that  


  • You have an account on the BI server
  • The publisher password on the BI Server is set up and you know it.
  • You know the name of the solution folder that you should publish the model to.
  • The URL to publish to is something like http://localhost:8080/pentaho/RepositoryFilePublisher
    Make sure you have
    RepositoryFilePublisher at the end of this URL!

Tips and tricks

Make use of Concepts

In the toolbar you can find the Concept Editor icon. Concepts are pretty much like CSS style definitions. Concepts can be assigned to each data point and are used in the final reports as default formats. One of the most important properties is probably Mask for Number or Date, which allows you to enter standard formatting strings (e.g. #,###.00).

To assign a Concept simply right click on the data point and choose Assign Parent Concept.

Referencing the same table more than once

In case one dimensional table is referenced more than once by your fact table, just drop the dimensional table several times into the business view and rename each of them. Then create separate relationships for all of them.

How to create formulas

Take a look at Pentaho Wiki for an introduction.

How to implement data security

Pentaho Wiki


  1. Click on your business model. Go to Tools > Security and import the roles from the Pentaho BI Server by entering following URL (amend if necessary):http://localhost:8080/pentaho/ServiceAction
    This will allow you to restrict the data for certain roles. If the connection works ok, you will see an XML extract of the roles definition.
  2. Go to your Business Model (this is one hierarchy below Business Models and has a brown briefcase symbol next to it) and right click, choose Edit. It is important that this is implemented on this level as otherwise it won't work.
  3. In the Metadata Security section add all the users/groups that you want to allow access. Assign the Update right to users that can save and edit their ad-hoc reports.
In the Data Constraint section add the users/groups and specify their access rights. If you want to restrict the access to a certain value of a specific column (row level security), specify it as follows: In this example we restrict the access to the country ITALY:[BT_SN_LT_COUNTRIES_SN_LT_COUNTRIES.BC_SN_LT_COUNTRIES_COUNTRY_NAME]="ITALY"
Also, if one user/group should have access to everything, you have to set the constraint to TRUE().
Read More
Posted in Metadata, Metedata editor, Pentaho, Pentaho Metadata Editor Tutorial, Tutorial | No comments
Newer Posts Older Posts Home
Subscribe to: Posts (Atom)

Popular Posts

  • Pentaho Data Integration: Remote execution with Carte
    Pentaho Data Integration: Remote execution with Carte Tutorial Details Software: PDI/Kettle 4.1 (download  here ), installed on your PC and ...
  • Pentaho Data Integration: Scheduling and command line arguments
    Pentaho Data Integration (Kettle): Command line arguments and scheduling Tutorial Details Software: PDI/Kettle 4.1 (download here ), MySQL S...
  • Pentaho PostgreSQL Bulk Loader: How to fix a Unicode error
    When using the Pentaho PostgreSQL Bulk Loader step, you might come across following error message in the log: INFO  26-08 13:04:07,005 - Po...
  • Pentaho Data Integration: Best practice solutions for working wit
    Pentaho Data Integration: Best practice solutions for working with huge data sets Assign enough memory Open pan.sh and kitchen.sh (and spo...
  • Using Parameters in Pentaho Report Designer
    Using Parameters in Pentaho Report Designer Introduction How to define a parameter Additional info about the new parameter dialog Hidden Par...
  • Pentaho Data Integration and Infinidb Series: Bulk Upload
    Pentaho Data Integration and InfiniDB Series: Bulk Upload Introduction Prepare Tables Using mainly Kettle steps Check if file exists Setup I...
  • PDI: Full Outer Joins
    Pentaho Data Integration: Full Outer Joins Creating full outer joins in Pentaho Data Integartion (PDI aka Kettle) is a fairly straight forwa...
  • Using regular expressions with Pentah...
    Using regular expressions with Pentaho Data Integration (Kettle) There are quite some transformations steps that allow you to work with regu...
  • Pentaho Kettle Parameters and Variables: Tips and Tricks
    Pentaho Kettle Parameters and Variables: Tips and Tricks This blog post is not intended to be a formal introduction to using parameters and ...
  • Pentaho Data Integration: Designing a highly available scalable s
    Pentaho Data Integration: Designing a highly available scalable solution for processing files Tutorial Details Software : PDI/Kettle 4.1 (do...

Categories

  • "Bulk Loader"
  • "Bulk Loading"
  • "Hadoop"
  • "Kettle"
  • "Pentaho Book"
  • "Pentaho Data Integration"
  • "Pentaho Kettle"
  • "Pentaho Report Designer MDX MQL JDBC Parameters How To"
  • "Pentaho Report Designer MDX Parameters"
  • "Pentaho Report Designer MQL Parameters"
  • "Pentaho Report Designer Parmaters"
  • "Pentaho Report Designer"
  • "Pentaho Reporting 3.5 for Java Developers"
  • "Pentaho Reporting Book"
  • "Routing"
  • "Schema Workbench"
  • "Testing"
  • "Unicode"
  • "Unit testing"
  • "UTF8"
  • Agile development
  • automated testing
  • Big Data
  • Book Review
  • C-Tools
  • CBF
  • Clustered transformation
  • Command Line Arguments
  • Community Build Framework
  • D3JS
  • Dashboarding
  • Data Integration
  • Data Warehouse
  • Database Change Management
  • Database Version Control
  • Date Dimension
  • DBFit
  • ETL
  • ETLFit
  • Federated database
  • Google Charts
  • Google Visualization API
  • Hadoop
  • HTML5
  • iReport
  • JasperReports
  • JasperSoft
  • JasperStudio
  • Kettle
  • Kimball
  • Loop
  • Master data management
  • Metadata
  • Metedata editor
  • Mondrian
  • multidimensional modeling
  • OLAP
  • Open Source
  • Parameter
  • Parameters
  • Pentaho
  • Pentaho BI Server
  • Pentaho Data Integration
  • Pentaho Data Integration 4 Cookbook
  • Pentaho Kettle
  • Pentaho Metadata Editor Tutorial
  • Pentaho Report Designer
  • PostgreSQL
  • PRD
  • Report Layout
  • REST
  • Routing
  • Saiku
  • Scheduling
  • Slowly Changing Dimension
  • Sqitch
  • SVG
  • Talend
  • Talend MDM
  • Talend Open Studio
  • Tutorial
  • Variable
  • Web service
  • Xactions

Blog Archive

  • ▼  2013 (24)
    • ▼  December (2)
      • Pentaho 5.0 Reporting by Example: Beginner’s Guide...
      • Going Agile: Test your Pentaho ETL transformations...
    • ►  November (3)
    • ►  October (2)
    • ►  September (1)
    • ►  August (3)
    • ►  July (2)
    • ►  June (1)
    • ►  May (2)
    • ►  April (1)
    • ►  March (3)
    • ►  February (1)
    • ►  January (3)
  • ►  2012 (20)
    • ►  November (3)
    • ►  October (3)
    • ►  August (1)
    • ►  June (1)
    • ►  April (1)
    • ►  March (3)
    • ►  February (5)
    • ►  January (3)
  • ►  2011 (19)
    • ►  November (3)
    • ►  July (2)
    • ►  June (1)
    • ►  May (4)
    • ►  April (2)
    • ►  March (1)
    • ►  February (3)
    • ►  January (3)
  • ►  2010 (17)
    • ►  December (1)
    • ►  November (6)
    • ►  September (1)
    • ►  August (1)
    • ►  June (2)
    • ►  May (1)
    • ►  April (3)
    • ►  February (1)
    • ►  January (1)
  • ►  2009 (18)
    • ►  December (3)
    • ►  November (1)
    • ►  October (5)
    • ►  September (7)
    • ►  July (2)
Powered by Blogger.

About Me

Unknown
View my complete profile